UAS Remote Sensing in a Medieval Castle Landscape in Alkmaar

UAS Remote Sensing on a Medieval Castle Site in Oudorperpolder, Alkmaar

Year: 2023

Supervision: Jitte Waagen

Execution and research: Jitte Waagen, Tijm Lanjouw, Alicia Walsh, Markus Stoffer, Mason Scholte

Project description: The drone remote sensing operations were commissioned by Nancy de Jong-Lambregts, municipal archaeologist of Alkmaar. In the Oudorperpolder, two castles have been built by count Floris V in the 13th century AD, the Middelburg and the Nieuwburg, and subsequently destroyed in the context of ongoing conflicts with the West-Frisians.

The drone operations were aimed at both complementing the existing state of the research based on historical sources, old excavation documentation, and Geophysical Prospection data collection, as well as at the methodological research into the potential of drone sensor archaeology in the context of buried stone remains in the Dutch landscape. An important archaeological and historical question is to what degree the landscape directly surrounding the castles could still present traces from that period of use, such as roads and connected buildings.

The analyses are still ongoing, but preliminary visualisations of the collected sensor data already generated some interesting clues as to both the castle areas themselves as well as the landscape directly surrounding the castles.

Publications:

Forthcoming

DJI M300 RTK ready for takeoff in the Oudorperpolder
Drone-generated thermal orthomosaic of the castle Middelburg area

Large-scale drone remote sensing at Rijnenburg, Utrecht

Large-scale drone remote sensing at Rijnenburg, Utrecht

Year: 2023-2024

Supervision: Jitte Waagen

Execution and research: Jitte Waagen, Mikko Kriek, Alicia Walsh, Mason Scholte

Project description: 

The drone remote sensing operations were commissioned by Erik Graafstal, municipal archaeologist of Utrecht. Rijnenburg is a development location of the municipality that in time will develop into a new urban district. People were already living on these higher river levees around the beginning of the common era. They lived in small hamlets of sometimes only two or three farms. The remains are presumably well preserved in the soil of Rijnenburg.

The aim of the overarching project is to save the most important archaeological sites as much as possible. In large developments such as Rijnenburg, archeology often only comes into focus once the master plans have been drawn, development positions have been negotiated and site preparation is about to start. Plan adjustment is then usually no longer an issue. In Rijnenburg, an innovative approach was chosen by bringing the inventory phase of the archaeological research to the forefront of the planning process.

As one of the applied methods, large-scale multisensory drone surveys are carried out by the 4D Research Lab over an area of ca. 350 hectares. Using LiDAR, optical, multispectral, and thermal sensors, the resulting data will be compared to already existing desk research and archaeological surveys, as well as new geophysical prospection measurements. The drone operations and analysis of the results is still ongoing.

For more information please check the project website.

Publications:

Forthcoming

Rijnenburg drone remote sensing area
Point cloud of the research area generated by thousands of drone photographs

Acquarossa Drone Remote Sensing

Optical and Thermal UAS research at the Etruscan site of Acquarossa, Italy

Years: 2018-2019

Supervision: Jitte Waagen

Execution and research: Jitte Waagen, Mikko Kriek

Project description: The drone remote sensing operations were part of an ongoing ACASA investigation directed by P. Lulof. Acquarossa is the name of an archaeological site consisting of the remains of an Etruscan settlement on the tuff plateau Colle San Francesco, in the province of Lazio and ca. six kilometers north of Viterbo, Italy. Previous excavations of the Swedish Institute in Rome (1966–1978) uncovered substantial urban remains throughout the area. They revealed various zones with Etruscan houses and public buildings which were inhabited from the late eighth century BC until shortly after the middle of the sixth century BC, when it was abandoned. With remains of foundations, walls, decorated roofs, and thousands of household utensils, it is one of the scarce examples of an intact Etruscan townscape.

Excavations in the outermost northeast tip of the plateau brought to light remains of Archaic habitation, with a structure interpreted as a domestic building dating from the last half of the seventh to the sixth century BC. The drone survey was oriented here, because of the attested remains of structures at a probably shallow depth. The drone operations were accompanied by a GPR survey, to generate a complementary dataset for the analysis of the efficacy of the remote sensing efforts.

Based on the combined data projections of both the thermal recordings and the GPR measurements, it could be shown that both techniques traced similar features, for example one that can be found as an anomaly northeast of the research area, which shows as an angular structure on the GPR data and has a clear thermal signature as well.

Publications:

Waagen, J.; Sánchez, J.G.; van der Heiden, M.; Kuiters, A.; Lulof, P. In the Heat of the Night: Comparative Assessment of Drone Thermography at the Archaeological Sites of Acquarossa, Italy, and Siegerswoude, The Netherlands. Drones 2022, 6, 165. https://doi.org/10.3390/drones6070165

3D Restoration at the Bonnefanten Museum

The Bonnefanten Museum in Maastricht houses the largest ensemble of Hortisculptures by the Dutch artist Ferdi (1927-1969). These colourful and eclectic sculptures have unfortunately experienced damage over time and are undergoing restoration by independent conservators, both at the Bonnefanten and at a studio in Amsterdam.

Aims

One such sculpture, the Shigiory Torinata, is a tall flower made from silk and artificial fur. It has tentacle like petals, a long stem, and rests in a wicker basket with leaves protruding out of it. The stem shows the majority of the damage, with tears in the fabric and along the seamline, as well as discoloration due to sun damage. In order to conserve this piece, the tears have to be sown and the discolouration restored.

For these reasons, the Shigiory Torinata has been chosen to be restored with the help of 3D methods at the 4D Research Lab.  Due to the stem's altered material, the pattern needs to be first documented in 3D, then virtually reconstructed, and finally printed onto new fabric that can be sown back onto the sculpture - without removing or modifying the original fabric.

Documentation

In order to document the stem's intricate pattern, the Artec3D Leo was used to scan the geometry with the texture. This handheld, structured light scanner offers a fast and high-resolution result.

Fortunately, the colour patterns displayed on the stem coincide with the patterns on the petals, which have experienced less light damage. These preserved colours allow us to replicate the pattern from the stem. After 3D scanning, colour measurements were taken of these petals using the Nikon D5300 camera, ring flash AR400, and a double polarised lens.

Digital Restoration

The next step after documenting the stem is to UV unwrap the pattern on Blender. However, since the fabric on the sculpture has wrinkled and bunched up in areas over time, it does not virtually unwrap flat. This causes distortion in the pattern, which has to be taken into account while reconstructing it digitally.

A 3D cylinder was created and aligned with the original stem and seam lines were assigned to it so that when the texture is projected onto this reconstructed cylinder, it can be unwrapped along those lines. This results in a flattened rectangular projection of the fabric.

The projection was transferred into Inkscape, an open source graphics editor. There the pattern was traced using curved line tools. Images from the tentacles with preserved colours were transferred into this workspace, and using the eyedropper tool, the correct colour was identified from each pattern. Colour swatches were created and these served the basis for reconstructing the colours of the stem. Twelve colours were identified in total, which will be verified in accuracy by the conservators working with these Hortisculptures.

Results

Once the pattern has been reconstructed, we brought it back into Blender and reapplied to its cylindrical stem by baking the pattern onto the original fabric and applying a silk texture map. In this way, we can visualise how the stem will look with its vibrant colours restored once the fabric is printed.


Credits:

Bonnefanten Museum

  • Charlotte Franzen, Head of Collections
  • Paula van den Bosch, Senior curator contemporary art

4D Research Lab

  • Tijm Lanjouw, Senior 3D Modeller
  • Alicia Walsh, Junior 3D Modeller

Conservation and Restoration

  • Ellen Jansen, University of Amsterdam, Independent conservator
  • Kaltja van de Braak, Independent conservator

Shinkichi Tajiri Estate

Shigiory Torbinata, 1966, Photo by Peter Cox, 
credits: Bonnefanten Museum
Shigiory Torbinata, 1966, Photo by Peter Cox, credits: Bonnefanten Museum
Tracing the pattern on inkspace
Original (left) and restored (right) stem.

ARCfieldLAB project announcement

Mason Scholte and Jitte Waagen

ARCfieldLAB. Innovative sensor technologies and methodologies for archaeological fieldwork: network, knowledgebase, and dissemination

BACKGROUND

The field of archaeological remote sensing has in the past decade seen significant developments in terms of novel sensor technologies and applications. These innovations can be applied to improve and expedite the archaeological fieldwork process in terms of the documentation, visualisation, and monitoring of archaeological features in a non-invasive manner, both on land as well as underwater.

With this blogpost, the 4D Research Lab presents ARCfieldLAB, a brand-new research project with the aim of creating an inventory of the most important technological innovations of the last ten years in the field of archaeological remote sensing, and disseminating this knowledge to improve the quality of archaeological research in the Netherlands. The project concerns a wide-ranging audience, including academic researchers, students, professional archaeologists and other specialists in this field (i.e. commercial companies or municipal and governmental archaeological services), and volunteers in archaeology.

This project is set to run for two years, and is funded by E-RIHS. E-RIHS is the European Research Infrastructure for Heritage Science which supports research on heritage interpretation, preservation, documentation and management. The mission of E-RIHS is to deliver integrated access to expertise, data and technologies through a permanent scientific infrastructure for heritage research, to which ARCfieldLAB will add a national digital platform for innovative methods and techniques and a collaborative network aimed at sharing experiences and best practices.

A core consortium led by the 4DRL of institutions firmly embedded in the Dutch archaeological sector or in the field of archaeological remote sensing has been appointed and acts as a steering committee this project. It consists of representatives of the Rijksdienst voor Cultureel Erfgoed (RCE), Stichting Infrastructuur Kwaliteitsborging Bodembeheer (SIKB), as well as the private sector (as represented by the Vereniging Ondernemers in Archeologie (VOiA)) and experts from Leiden University (LEI), the Free University of Amsterdam (VU), and University of Amsterdam (UvA).

An example of a recent innovation in archaeological remote sensing: drones are increasingly being utilized as remote sensing platforms.

THE PROJECT

There are two main components which constitute ARCfieldLAB:

The first component is the collection and dissemination of knowledge on innovative sensor technologies which can be applied to archaeological fieldwork by a) creating an overview of these developments in the last decade and sharing this knowledge through a publicly-accessible online knowledge base of resources and best practices, and b) providing examples of successful applications of the novel technologies and methods by which their value and potential for the archaeological fieldwork process is illustrated.

The second component is the organisation of a number of expert meetings, in which the possibilities and added value of innovative sensor technologies are elucidated and space is provided for experience in the application of these techniques to be exchanged. To promote multi-disciplinary collaboration, participants in these meetings will come from various sectors: archaeological professionals and academics, both from Dutch and international contexts, as well as remote sensing outside of the archaeological field. Additionally, workshops will be hosted for the promotion and education of these techniques.

As part of this project, various case studies will take place. These case studies serve to expose and fill in existing gaps in the knowledge of archaeological remote sensing in The Netherlands and aid in the development of best practices. The potential of the technological innovations which have so far not seen wide application in Dutch archaeology (but possibly have seen use in other countries or other sectors) as well as the efficacy of combining multiple remote sensing data sources in one site will be tested.

A graphical abstract of the ARCfieldLAB project.

EXAMPLE CASE STUDY: SIEGERSWOUDE

An example of a case study assessing the potential of a novel sensor technology in the context of Dutch archaeology is the use of drone-based thermal infrared remote sensing at the late medieval site of Siegerswoude, Friesland.

The theory behind thermography has previously been described in a previous blogpost, where it was used at the site of Halos in Greece. This pilot at Siegerswoude adds to a body of case studies which can be systematically compared to determine to what extent certain variables (e.g. soil composition, time of day, soil humidity, thermal properties of archaeological features) influence the outcome of an archaeological survey using drone-based thermography.

Historical sources associate the village of Siegerswoude, currently located on the meadow of a dairy farm, with a late-medieval grange from a regional Benedictine monastery situated approximately one kilometre west of the site. The site itself consists of at least five rectangular plots, evenly spaced along an axis and encircled by ditches.

Thermal imagery taken at the site revealed multiple traces which contrast with the background (marked A-E on the image) that have been identified as being archaeological in origin. The clearest of these is the rectangular ditch encircling the westernmost plot of land (A), visible on both the orthophoto as well as LiDAR data, which has a distinct thermal signature. On the northside of this feature, a double line is visible which is not present on the non-thermal data sources. Other traces included a rectangular trace in the centre of the western plot (B), long lines in SW-NE direction (C), and part of a ditch encircling the eastern plot (D) which continues into a similar double line feature as near (A). Test trenches have further validated these results, and provided insights into the use of this area: the ditches were used for draining the surrounding peat landscape, as well as for the extraction of loam.

One of the main takeaways from this survey, is the fact that thermography is capable of identifying archaeological features which are not visible on both orthophotos and LiDAR data of Siegerswoude. Furthermore, the noticeable differences in visibility of thermal signatures on the thermal imagery taken at different points throughout the day at Siegerswoude serves as a prime example of the importance of understanding the influence of variables on the results of these surveys.

The site of Siegerswoude as it is located in the Netherlands, together with optical imagery and AHN3 height data.
Thermal imagery from Siegerswoude showcasing various traces (indicated A-E).
References:
Waagen, J. & van der Heiden, M. (2021). Casestudy Siegerswoude-Middenwei. Thermisch infrarood remote sensing van een laatmiddeleeuwse nederzetting. In Archeologische prospectie vanuit de lucht.: Remote sensing in de Nederlandse archeologie (landbodems). Rijksdienst voor het Cultureel Erfgoed, p. 76-78.
Waagen, J., Sánchez, J.G., van der Heiden, M., Kuiters, A., & P. Lulof (2022). In the Heat of the Night: Comparative Assessment of Drone Thermography at the Archaeological Sites of Acquarossa, Italy, and Siegerswoude, The Netherlands. Drones, 6, 165. https://doi.org/10.3390/drones6070165
Rensink, E., Theunissen, L. & H. Feiken (eds.) (2022). Vanuit de lucht zie je meer. Remote sensing in de Nederlandse Archeologie, Amersfoort (Nederlandse Archeologische Rapporten 80).

Drone-based remote sensing at Halos, Greece

Elon Heymans and Jitte Waagen

Drones are gaining ground as a versatile tool for archaeological prospection. Cheaper and more efficient in use than conventional airplanes, high-end drones available on the consumer market can be mounted with different cameras and sensors, thereby creating what is essentially a flying modular remote sensing lab.

The advantages of drone-based prospection versus traditional methods in terms of logistic- and cost-efficiency, make it an attractive tool for exploring archaeological landscapes. Moreover, a drone can fly at different altitudes, unhampered by vegetation or relief, and because all it really needs is a charged set of batteries, it can carry out many survey flights collecting a large amount of data. These advantages make drones particularly suitable for experimental research setups that that facilitate a steep methodological learning curve and allow for the development of best practices, while at the same time contributing to site-specific research questions.

Testing Ground: Ancient Halos

The archaeological landscape of ancient Halos in central Greece provides a good testing ground for the possibilities that drone-based prospection has to offer. Dutch archaeologists from Groningen (RUG) and later Amsterdam (UvA), in collaboration with colleagues of the Greek Archaeological Service (the Ephorate of Volos), have been active in the region for over 40 years; and also work carried out by the Archaeological Service around the construction of the Athens-Thessaloniki highway has contributed much to our knowledge of the area.

Halos is mentioned already in Homer’s Iliad, yet research has not really been able to identify a settlement centre for the Iron Age (12th – 8th century BCE). As confirmed by later sources, it is likely that during the course of the Iron Age and archaic period Halos emerged as an independent political community, a Greek polis. Yet, how this community of citizens really came about is not completely clear. A large funerary plain measuring over 200 ha and used by people living in the surrounding area between the 12th and 6th century BCE can offer an important view on how this landscape was used through time and how people came together thereby shaping new and collective identities.

The Voulokaliva Funerary Landscape

While the area boasts virtually no substantial Iron Age settlement remains, this funerary plain, known as the Voulokaliva, is one of the largest Iron Age cemeteries in Greece. It is dotted with over thirty tumuli, some of which remain more or less intact (although their preservation is under pressure due to continued agriculture), and can often be recognised as a scatter of stones or elevated stone heaps, resulting from the fact that farmers plough out large stones, which are then deposited together. Other tumuli have been looted or excavated (Stissi et al. 2004). In a single instance, an excavated tumulus (site 36) contained 74 cremation burials, made over the course of several centuries, with the tumulus (eventually) being closed off with a cover of small stones (Lagia et al. 2013). Moreover, excavations carried out along the route of the highway suggest a spread of single burials in between the mounds.

Drone Remote Sensing
A Google Earth generated image overlooking the Almyros plain and the Pagasitic gulf to the northeast with the city of Volos in the centre on the other side of the gulf and the acropolis of Hellenistic Halos at the bottom. The Voulokaliva is located adjacent to the highway; Magoula Plataniotiki is located closer to the coast
A drone photo of the Voulokaliva looking in western direction with the nearby village of Neos Platanos beyond the highway, several arrows indicate visible tumulus sites

Drones aloft

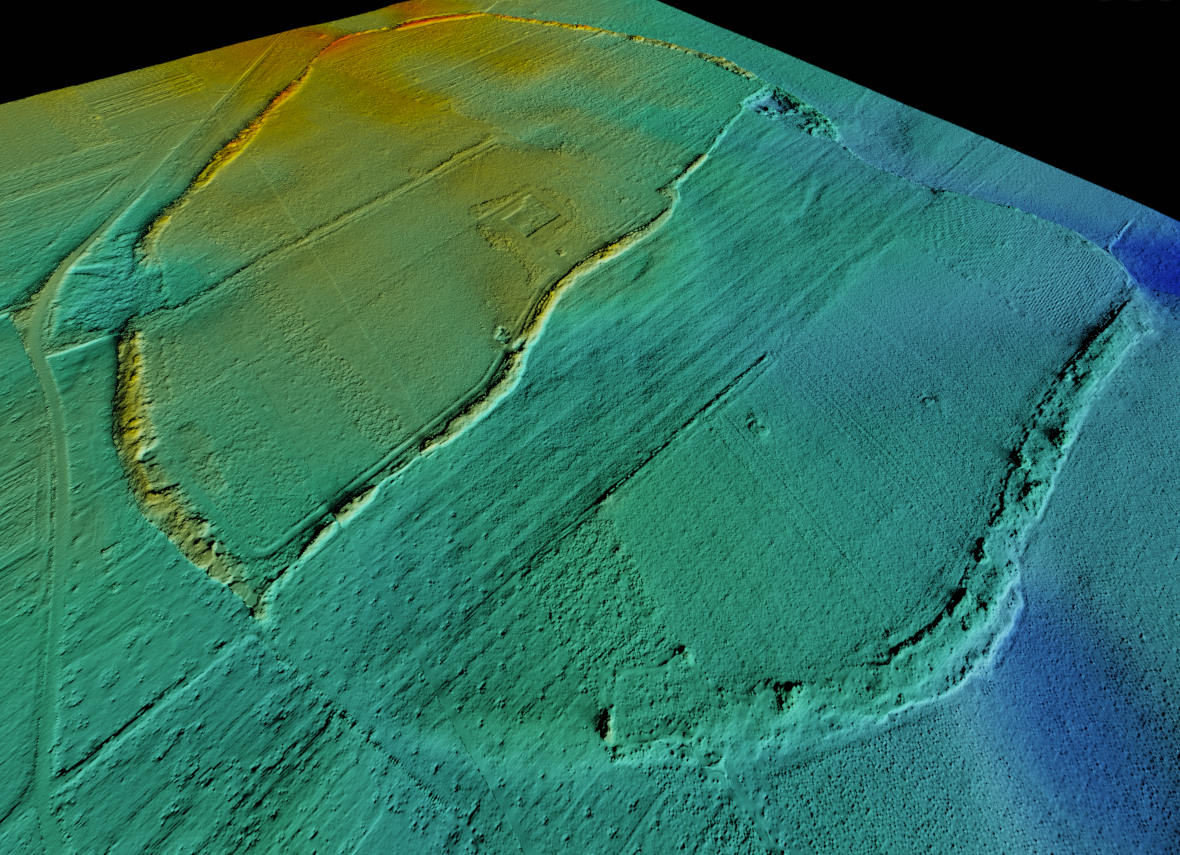
While a better understanding of this extensive area is key to answering important historical questions, we also have a lot to learn from the process of researching it, not only in developing and finetuning our methods, but also in mapping the area and thereby complementing earlier survey and excavations. This is done by collecting large numbers of images with sufficient overlap and processing these into detailed 3D models that can be further analysed but also offer new visualisations. Using dGPS measured targets (mounted onto 1x1m aluminum plates) that can be easily identified in the images, these models have a high level of precision and can be placed in a GIS (Waagen 2019). In order to contribute to our understanding of the area as part of the study of the field survey data, we have focused our efforts on six areas or test sites, also included in the survey. Four of these (A–D) contain clusters of tumuli, giving the possibility to take a detailed look at these sites, while not losing sight of potential ‘off-site’ remains. The remaining two test sites are settlements: a small prehistoric settlement site located on the southern end of the Voulokaliva (site 35), and the Classical/Hellenistic settlement at the nearby tell-site of Magoula Plataniotiki, where excavations have been ongoing since 2013.

Thermography

Our approach uses thermal infrared imaging as a remote sensing technique. By measuring minute temperature differences on the surface, an advanced thermal camera can document material differences in the soil, including potential subsurface archaeological remains (Casana et al. 2017). Think of the fact that on a sunny day, a car can turn hot enough to fry an egg on its hood, but a grassy lawn would still stay cool. This is simply because some materials can easily heat up in the sun (due to their high thermal conductivity), and retain and emit a lot of heat (i.e. high heat capacity and thermal emissivity), while others (notably water) are more resistant to temperature fluctuations (something known as thermal inertia). Because different materials, due to variation in composition, density, moisture content, conductivity of the matrix etc, respond differently to temperature fluctuations, we can observe differences in the pace at which they heat up and cool down again. Such differences result from the diurnal flux (the difference between day and night), but are also affected by longer term (weeks) temperature fluctuations.

An Experimental Workflow

As the reflection of sunlight has a large impact on the measurable thermal radiation, the theory prescribes that it is best to fly between sunset and sunrise. Because the clarity of a thermal signal results from a variety of factors, our strategy is to collect data at different times during the night (after sunset, in the middle of the night and before sunrise) and in different times of the year (July, November and April). Collecting data under all these different circumstances allows us to systematically compare the images that we have. This is a versatile approach because comparing images recorded under different circumstances helps us to understand and interpret what we are seeing, but also because it enables us to understand what conditions are most favourable for recording clear thermal signals at Halos.

At the same time, a systematic approach of this sort is also labour and data intensive. In the summer, nights are already short, but when you go flying about with a drone, they become challengingly short. And when not out in the field, we do administration work – keeping records for each and every flight, diaries of different sorts, and storing and (if possible) processing images.

Bad Weather

The preliminary processing of images is quite important, as we discovered last November. Having arrived to Greece after days of pouring rain, the clay-rich soil was completely saturated. With a limited diurnal temperature flux (between 10 – 14° C.) and no direct sunlight during the day, we soon discovered that the thermal imagery recorded on our first evening flights did not contain sufficiently distinctive information to enable proper photogrammetric processing. This forced us to adapt our strategy, but for the better. We decided to take high-altitude thermal overview photos, while focusing on specific test sites.

Multispectral Imaging

Luckily, we had other possibilities as well. Another sensor we use is a multispectral camera. More commonly used in agriculture, this camera captures images at different wavelengths of light, thereby enabling the visualisation of differences in vegetation, crop health and soil humidity. Think of the fact that subsurface archaeological features might impede or stimulate plant growth, or could prove favourable for certain plant species at the cost of others. The resulting patterns, known as crop marks, have long been studied through traditional aerial photography. Multispectral images are not only complementary to what can be observed in normal images, but provide a much more specific, diverse and detailed image. Paired with thermal imaging, this is already proving its worth as an effective prospection method (Agudo et al. 2018; Sagaldo Carmona et al. 2020).

In addition to a detailed 3D optical model of the whole Voulokaliva site, produced in November as well, the datasets we collected offer detailed remote sensing data of this extensive funerary site. One additional week of fieldwork is planned for early April, after which we can fully compare and analyse the different visualisations. So, to be continued.


A satellite image of the Almyros plain and the southern end of the Pagasitic gulf, showing our research area
A thermal image of us in the field

Credits

This project is part of the Halos Archaeological Project, which is a cooperation between the Universities of Amsterdam, Groningen and Thessaly, and the Ephorate of Antiquities of Magnesia. It is undertaken as part of the study towards the final publication of the 1990–2006 field survey. We thank dr. Vaso Rondiri, professor Reinder Reinders, and professor Vladimir Stissi for their kind support. The project was made possible through a grant from the Stichting Nederlands Museum voor Antropologie en Praehistorie (SNMAP), the support of professor Stissi/Amsterdam Center for Ancient Studies and Archaeology, the 4D Research Lab and the Stichting Thessalika Erga. Fieldwork is carried out by Elon Heymans, Jitte Waagen and Mikko Kriek.


A screenshot of photogrammetric processing software, showing the drone positions of captured imagery, and the 3D textured mesh of the Voulokaliva area
Left: an orthomosaic of test site A, showing an elongated stone heap on tumulus site 22; centre: a DEM of test site A clearly showing a large tumulus (site 22) and a smaller elevation (site 39) directly to its east – both based on optical images taken in November 2021; right: an NDVI (normalized differentiated vegetation index) image based on multispectral data, recorded in July 2021, also showing sites 22 and 39

References

Agudo, P., Pajas, J., Pérez-Cabello, F., Redón, J., and Lebrón, B. 2018. ‘The Potential of Drones and Sensors to Enhance Detection of Archaeological Cropmarks: A Comparative Study Between Multi-Spectral and Thermal Imagery.’ in Drones, 2(3), 29.

Casana et al., 2017, Archaeological Aerial Thermography in Theory and Practice, Advances in Archaeological Practice 5 (4) 310-329.

Lagia, A., Papathanasiou, A., Malakasioti, Z., and Tsiouka, F. 2013. ‘Cremations of the Early Iron Age from Mound 36 at Voulokalyva (ancient Halos) in Thessaly: a bioarchaeological appraisal,’ in Lochner, M., and Ruppenstein, F. (eds.) Cremation burials in the region between the Middle Danube and the Aegean, 1300–750 BC. Proceedings of the international symposium held at the Austrian Academy of Sciences at Vienna, February 11th–12th, 2010. Vienna, 197–219.

Salgado Carmona, J.A., Quirós, E., Mayoral, V., and Charro, C. 2020. ‘Assessing the potential of multispectral and thermal UAV imagery from archaeological sites. A case study from the Iron Age hillfort of Villasviejas del Tamuja (Cáceres, Spain),’ in Journal of Archaeological Science: Reports 31.

Stissi, V., Kwak, L., and de Winter, J., 2004. Early Iron Age. In: Reinders, R. (Ed.), Prehistoric Sites at the Almiros and Sourpi Plains (Thessaly, Greece). Assen, 94-98.

Waagen, J., 2019. New technology and archaeological practice. Improving the primary archaeological recording process in excavation by means of UAS photogrammetry. Journal of Archaeological Science, 101, 11-20.


The challenge of digitally reconstructing colour and gloss: the UNESCO Pressroom case study

Project background

How can virtual visualisation support decision-making in the restoration of historical interiors? In 2018, conservator in training of historic interiors Santje Pander, won the '4D Research Lab' launch award for her project on the UNESCO Press Room, by the renown Dutch architect and furniture maker Gerrit Rietveld. The room was designed for the UNESCO headquarters in Paris in 1958, but had become redundant and old-fashioned by the 1980s, after which it was dismantled and shipped back to the Netherlands for safekeeping by the Cultural Heritage Agency of the Netherlands (RCE). In recent years, the room has been brought back into attention, and was revaluated, which led to ideas about its possible reconstruction (recently a space has been found for the interior by the RCE).

For her MA thesis, Santje studied the possibilities of reconstructing specifically the linoleum surfaces of the room, which were designed as a unique pattern of shapes and colour that covered both floor and furniture. She proposes various alternatives for the reconstruction of the floor. The main choice regards the reconstruction of the linoleum floor using linoleum from the current FORBO (the original manufacturer) collection, or using a newly produced reconstruction of the old linoleum. For the latter option, two alternatives were proposed: reconstruct the linoleum to match the aged and faded colours of the furniture, or reconstruct the linoleum 'as new', based on samples found in the FORBO archives. An important consideration is whether the reconstruction respects the original intensions of Rietveld, who designed the floor and furniture (and in fact the entire interior) as a unity. The concept of unity was especially important since the architecture of the room itself impeded a sense of unity due to its irregular shape, and awkward positioning of structural colums.

The digital 3D reconstruction of room and furniture

Although Santje's main focus was on the elements covered with linoleum, it was clear from the start that in order to to gauge the effect of certain choices on the perception of the room, the entire space had to be digitally reconstructed. This included features such as walls covered in different vinyls, wooden painted cabinets of various types, mirrors, windows, furniture with vinyl upholstry, concrete architectural elements, and of course the TL-lighting. A unique object was the so-called 'world-map table', a table with a light box type tabletop, which featured a map of the world. Fortunately, the original design drawings were preserved, as well as many (but not all) of the original objects. During modelling, the designs were compared with the photographic evidence and the preserved pieces in the depot, which reveiled only small divergences between design and execution. Hence, certain details aside, the reconstruction of shape and dimensions is generally of a high degree of certainty. As an added benefit of the modelling process, we gained some insights regarding certain design decisions by Rietveld, which we discuss in more detail in the project report.

Work in progress. Integrating the original paper designs with the model.

Reconstructing colour and gloss

For the reconstruction of the colours, we used colour measurements that Santje performed on the original linoleum samples and cleaned surfaces of the original furniture. The colour measurements were originally done with a X-rite Minolta i7 spectrophotometer, but we noticed that these diverged from the colours as measured on photographed samples, even though the light conditions of the spectrophotometer were matched by the studiolights. So we used both, to see if there was a noticeable effect on the reconstruction.

In restoration science, much attention is paid to accurate recovery of material properties such as colour and gloss of a surface. Subtle differences may detract from the experience of the authenticity of an object. However, accurate digital reproduction of these properties is not an easy task. The scientific approach would be to objectively measure colour and gloss, and then to enter these values into the 3D modelling program. This is not as simple as it seems. Colour is nothing more than certain wavelengths of light being interpreted by our brain, which 'colour-codes' it for us on the fly. This helps us to distinguish different kinds of objects. Colour perception varies across our species, so it is is very hard to objectively define colour. Also, colour is dependent on light: the same object has a different colour or tint under different environmental lighting conditions. So when we 'measure' colour, we basically measure a surface under specific conditions. Usually, this is 'daylight', which is a soft whitish light that we arbitrarily define as 'neutral'. However, in 3D modelling programs you create another virtual environment with lamps with specific properties, which means that the surface with the measured colour value is lit again, but under different conditions (in the case of the Pressroom: TL-lighting), creating yet another colour. And it becomes even more complex, since we also have to deal with the fact that there exists no single system to store and represent colour ('colour spaces'), and the digital model we use on devices (RGB) is a strong simplification of our own perception. Long story short, to match the colour and appearance of an object in a 3D program with simulated lights is ultimately a subjective process of trial and error.

Gloss on the other hand is basically the result of the microscopic roughness or bumpiness of a surface. The rougher a surface is, the more light gets dispersed, the more matt a surface appears. The smoother it is, the more it reflects light back to the observer. The smoothest surfaces are mirrors. There are devices that measure gloss, which was used by Santje in her material study. However, the resulting values cannot be simply entered in the 3D program we used (Blender), since it uses an entirely different model for computing gloss. So our method was to closely observe the original linoleum samples and linoleum floors in the real world, and try to match this in the 3D modelling program.

Historical linoleum samples on top of a modern linoleum floor. Photo by Santje Pander.
The effect of using a different colour measurement method. Left: RGB measurement on photos. Right: photospectometric measurement.
Photo of the Pressroom by UNESCO/D. Berretty.

Rendering

We created multiple renders with different material settings from the same perspective in order to compare the effects on the perception of the room. On purpose we chose a viewpoint that matched one of the historical photographs, so it was possible to compare this directly to the digital reconstruction. As the 1958 colour photos have known issues regarding the representation of colour, the marked difference was an interesting result that calls for reflection on how accurate our reconstruction is and how faded colour photos can cause a wrong impression of the original room.

The perceptual difference between the room in which modern alternatives of the colours are applied and those in which original colours are applied is especially striking. The difference between the images which show variations of the original colours ('as new', and 'aged'), is less perceivable. Although the actual RGB values are notably different when viewed next to each other in isolation, if applied in the room itself, differences are only noted after very close examination. It may be that the multitude of visual stimuli in the entire picture make it very hard for our brains to perceive small differences.

Render of the Pressroom from the same perspective as the photo. Colours based on colour measurement on original linoleum samples.

Reliability

The question remains whether these results are reliable enough to be used in the restoration decision-making process. There are multiple factors of uncertainty, the method of digital colour and gloss reproduction being an important one. Another factor is that we do not exactly know the original light conditions inside the room. We know that TL-lamps were used, but not exactly their power and light temperature. Based on these uncertainties, it can be argued that it is questionable that we have accurately recreated the interior. The model should therefore be considered as such, a working hypothesis about the physical appearance of a lost space. But we must not forget that an authentic recreation has in this case never been the aim. Moreover, it is quite unlikely that modifying the uncertain variables within reasonable bounds would have changed the outcome of the study significantly. Nevertheless, to model colour and lighting more accurately based on real world measurements, the digital methods we use also must improve.

Render of the Pressroom using colours available in the current FORBO collection, with a modern, glossy coating.

A virtual visit

The project got a nice spinoff in the form of an online 3D tour through the room, made in collaboration with the RCE. For this application we expanded the model to complete the room, and it was integrated with stories about the room from a design perspective. Of course, for this application we can only show one of the versions that we recreated. As a side note in respect to the above, the modifications and conversions necessary to be able to render the model in the browser create again a slightly different version of the room. This underlines the importance for us, researchers in the humanities, to understand and be transparent about the technical procedures and cognitive processes that lead to the creation of such digital 3D representations.


Screen capture of the virtual tour

Visualizing the process of facial reconstruction in AR

Render of the 3D scan of the original bone fragments and 3D models of the facial reconstruction by Maja d’Hollosy.

We have written about our Augmented Reality projects before, here, here, and here. But we never talked about one of our original case-studies that motivated us to start working with AR in 2018: visualizing the process of reconstructing a human face from fragments of an excavated skull of a Russian soldier who died in the battle of Castricum in 1799. This was an unfunded side-project, an experimental case meant to get to grips with AR technology, which is why it had been lying around nearly finished for over a year. But we finally got around to make an improved version, thanks to the spillover of lessons learned in the Blended Learning projects. In this post I’d like to discuss the project background and process of creation.

Battle of Castricum, 1799

In 1799 a war took place in Holland that we don’t learn about in Dutch history class in school, hence referred to as ‘the forgotten war‘. The Dutch were under French rule, and their joint armies clashed with those of Great Britain and the Russian Empire in the dunes near Castricum. The casualties were high and many soldiers found their death in these dunes. They were buried there in simple graves, wearing their uniform. Occasionally, a grave is found by accident and excavated. The nationality of the soldier can usually be derived from buttons, the only surviving pieces of the uniform.

Visualizing archaeological interpretation

The reconstruction of a face based on an excavated skull is an intricate process that combines forensics, archaeology, and anatomy with the art of sculpting. When so many disciplines are involved, some already rare in itself, it may not be surprising that this skill is not widely spread amongst humanity. Nevertheless, it is an extremely important aspect of our study of the past, as it gives a face to people who lived many years ago in societies we only know from their material remains. One of the people with these skills and expertise is Maja d’Hollosy, who works at ACASA as a physical anthropologist, but is also a freelance facial reconstruction artist. Her work has been featured in many archaeological exhibitions in the Netherlands and even on national television. The popularity of these reconstructions is not hard to fathom: there is something magical about looking in the eye of a person who lived thousands of years ago, modelled to such a degree of realism that it is hard to distinguish from a real person.

But these kind of reconstructions are often met with questions from the public: how do you know how a face looked like just by studying the skull? Would this person really have looked like this? This sure is very speculative? These are valid questions, that in fact pertain to all archaeological interpretation: how can we be so sure? As we often can’t, the least we can do is to be honest about our method and assumptions. In the case of the physical anthropological method of facial reconstruction, this is certainly not a complete gamble. Human facial features strongly correlate with the underlying bone structure, and facial reconstruction is for a large part a matter of applying statistics on muscle and skin thickness. On the other hand, skin colour and facial hair cannot be read from the bones of course.

Still, this part of our work, the art of reconstruction and interpretation, remains often underexposed in public outreach. The usual excuse is that ‘the public’ isn’t interested in learning how we got there, they just want the final picture. We don’t think this is true, at least not for all of the public. Loeka Meerts, an archaeology student at Saxion, University of Applied sciences, did a study into the possibilities of using AR for presenting archaeological facial reconstructions, and found that over half of the respondents (n = 42) were interested in learning more about how these facial reconstructions are made.

This is where we believe Augmented Reality can come to play a role. AR offers a way to enrich and superimpose reality with a layer of additional visual information. So why not use it to visualise the process of interpretation on top of a target object, the reconstructed fact?

The idea

The aim of the AR is to visualise the steps taken by Maja for the reconstruction of a face, from archaeological remains to full reconstruction including skin colour and hair. The basic mechanism is very simple: a user points a mobile device at a target, a 3D printed version of the reconstructed skull, and the original fragments of the incomplete skull appear on top of it. From then on, the user can swipe his or her way through the process of facial reconstruction. The user can walk around and view the reconstructions, digital 3D models of Maja’s work, on all sides. The videos on the side demonstrate the app.


Video 1: the AR in action on the original 1:1 target.
Video 2: the AR on the smaller keychain target.

3D scanning and photogrammetry

To make this possible, we needed 3D models of each of the steps in the reconstruction. The original bone fragments had already been scanned with a high resolution 3D scanner (the HDI advance R3x ). Maja needed this scan for a 3D print of the fragments, which she used as the foundation for the sculpting process. Next, we chose six steps that are essential in the facial reconstruction process:

  1. the reconstruction of the fragments into a complete skull
  2. the placement of tissue thickness pins
  3. the modelling of muscle tissue
  4. the application of skin
  5. the colouring of the skin
  6. the application of (facial) hair

Each of these steps was recorded using photogrammetry. About 140 photos were taken in three circles around the subject. This number of photos give good quality high resolution 3D models with no occluded parts. The photos were processed in Agisoft Metashape. The sculpts are easy photogrammetry subjects, as they have much detail that can be used by the software to match photos, and they contain hardly any shiny or transparent parts. The results were generally very good, although a problem does exist with some of the transparent tissue thickness pins of step 2. Also, hair is a notoriously difficult material to reconstruct photogrammetrically, so the last step did not come out the neatest. All such issues could of course be fixed with manual tweaking of the models in 3D modelling software. However, correcting such defects, especially the hair, requires manual editing of the 3D model and textures, which is quite a time-consuming task. So we left that for another moment.

The photogrammetrical reconstruction results in very dense meshes, which need to be simplified for display in an app that should run on a phone. Each scan was thus decimated to 50.000 faces. Still a sizeable number, but it is manageable by most devices. Although you lose geometric detail, this is hardly noticeably as the generated photo-textures bring back all visual detail. Besides photo-textures, also ‘normal’, and ‘ambient occlusion’ maps were generated based on the high resolution models. These are used to create the illusion of depth on the small scale, such as bumps and pores of the skin, which were lost due to the decimation process.

The AR app

The next step has been to create the Augmented Reality application. The AR software we used was Vuforia. Vuforia is an AR engine, which means it just takes care of the target recognition. To display the 3D models and to build user functionality, you need a game engine. Vuforia is well-supported by the Unity game engine, so Unity was a logical choice. The reason for choosing Vuforia, was that in 2018 it had just introduced an exciting new feature: 3D object recognition. In older AR, you would need a 2D image or QR-code, to act as trigger and target for the placement of the AR model. With 3D object recognition, you use a 3D model of the actual object as a trigger. This does not work out of the box. You need a 3D model of the physical target, and if you want 360-degree recognition, this has to be run through a ‘training session’. This is basically a machine-learning algorithm that analyses the object and stores a series of target images in a database. This database is imported in Unity, where you set up an AR camera and lighting, the 3D models, materials, and program user interaction. The latter was done by Markus Stoffer, student assistant at the 4DRL and specializing in AR/VR.

The target that we used is a 3D model of the first step in the facial reconstruction, the bone fragments reconstructed to a complete skull. The target was 3D printed in PLA on the Ultimaker 2+, and painted in skull-colours afterwards.

Photographing the skinned reconstruction. Photo by Maja d’Hollosy.

Photogrammetric reconstruction of one of the steps.

3D print of the target, as it came out of the printer.

3D print of the target painted and mounted.

Unity game engine environment.

The 3D models used in the AR application.

Improvements and the future

In the current app a user simply skips between the steps that show the process of facial reconstruction. Because the original focus was on learning how to work with Vuforia/Unity, and to create a nice AR example that we could easily show-case in the lab, we did not add an informative layer. For use as an educational tool in a museum environment, this could be a useful next step. Adding text, or probably better still, audio, giving background information about the steps taken by the sculptor, is a relatively small effort. The curator at Huis van Hilde, the museum which houses the archaological finds and the reconstruction of the Russian soldier, has shown interest in exploring options for the actual implementation in the exhibitions.

An interesting question is whether an AR app satisfies the needs of a museum audience. In Loeka Meert’s survey, museum visitors were interviewed about their preferred medium of learning more about the reconstruction. Only 20% of the respondents chose ‘an app on their phone’, while the largest percentage of interviewed museum visitors (41,40%) chose to be informed through a digital screen next to the face reconstructions. It is likely that familiarity with digital screens in a museum setting as opposed to AR apps influenced the outcome of the survey. Regardless of the causes, to make visitors use new innovative technology requires a seamless user experience.

In that respect, one element that should certainly improve is the target recognition. For instance, we have been struggling to get the smaller keychain model target (see video above) to work. It appears that the size has an impact on the recognizability, but why and how this works remains unclear. Vuforia’s algorithms are closed-source, and it is hard to see what exactly is causing problems. Also our other experiments with AR in a museum showed that target recognition and visual stability was an unpredicable factor and varied from object to object. However, target recognition and visual stability of the augment are very important elements when it comes to user experience. In that sense the AR technology still has some way to develop before 3D object recognition can function without problem on our mobile devices.

Principles and standards

We finally got around writing up the 4D Research Lab approach on 3D visualisation. For the use of virtual reconstruction in the context of academic research, it is paramount to have a clear conception on both the modeling process as well as the final result, and communicate this as well as possible. Thorough research, responsibility, transparency and verification are key-concepts here. For the 4D Research Lab principles and standards, this amounts to:

  • A principle statement, in which we define the role of 3D visualisation in academia, our views on academic rigour, accessibility and sustainability. As for academic rigour, we build forth on “The London Charter for the computer-based visualization of cultural heritage” and the “Principles of Seville, international principles of virtual archaeology”.
  • A template, which is the application of the principle statement into a standard format for execution and documentation of 3D visualisation projects, and compiling reports.
  • A definition of our take on dealing with (un)certainty in 3D visualisation, accompanied with a 6 degree classification of certainty levels.

These standards and principles will be applied to all projects of the 4D Research Lab to ensure uniformity but also to create a database to be able to compare their performance. Surely, in due course we will find that we might improve on our project template or classification of (un)certainty. We do not consider them written in stone, but as a culmination of our experience so far, and they will surely be susceptible to future evolution into better versions of themselves.

Certainty Class

Variability

Indication


Example

Colour

Certain

None

Empirical

Scanned remains

89a5c1

Quite certain

Low

Logical extension

Missing part of relatively complete
object

95bf8f

Moderately certain

Limited

Close parallel

Same type, direct relation

eee3ab

Not so certain

Considerable

General parallel

Same type, indirect relation

d9cfc1

Quite uncertain

High

Historic context

General stylistic traditions

a77e58

Very uncertain

Very high

Theoretical

Constructional argument

ba3f1d

LiDAR data visualization of a protohistoric defensive circuit in Southern Italy using GIS and Blender

DTM of the Muro Tenente defensive curcuit

Over the last decade, high resolution elevation data from LiDAR surveys has lead to much better understanding of archaeological features. 4D Research Lab coordinator and ACASA researcher Jitte Waagen has been experimenting with a number of visualization techniques to study the site of Muro Tenente in Apulia, Southern Italy. Muro Tenente is a vast defensive circuit dating to protohistoric (pre-Roman conquest) times that has been under investigation by archaeologists of the Vrije Universiteit Amsterdam.

Continue reading “LiDAR data visualization of a protohistoric defensive circuit in Southern Italy using GIS and Blender”